We have been asked several times about the rising Canvey population so I have produced a chart showing the increasing figures from 1851-2001.
The charts shows the totals in hundreds. The first chart does not show very clearly the earlier figures because the first line is for 10,000 so I have put on two further charts from 1851-1911 and 1911-2001.
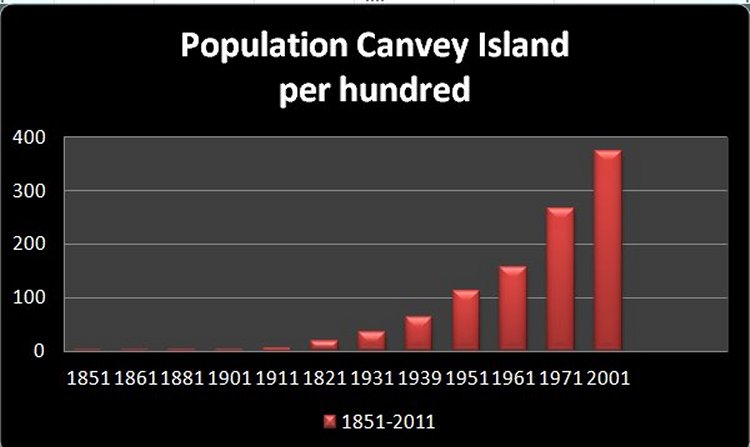
This chart shows the population for the years 1851-2011 per hundred
The first line across is 10,000 in 1951 the population was 11,258.
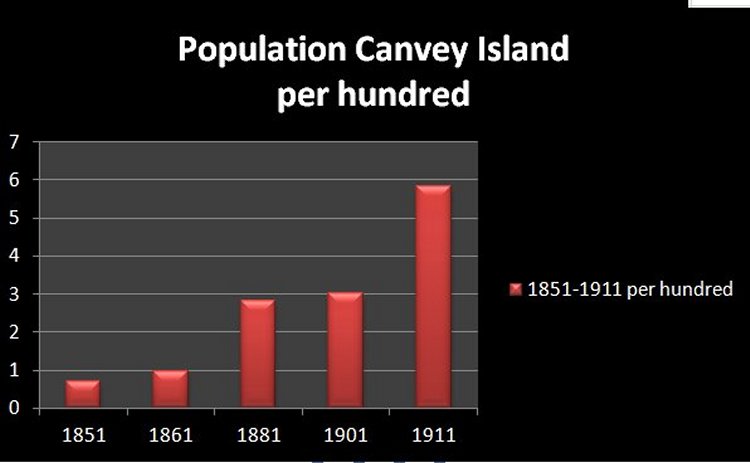
This chart shows the population for the years 1851-1911 per hundred
The first line across is 100 in 1861 the population was 96.
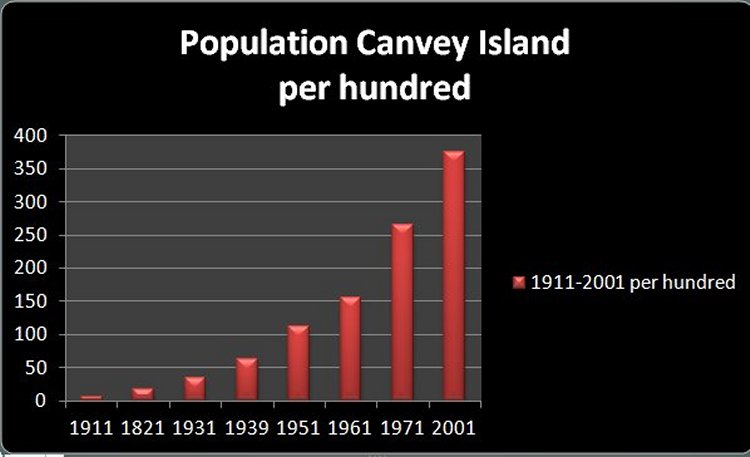
This chart shows the population for the years 1911-2001 per hundred
The first line across is 5,000 in 1939 the population was 6248.


No Comments
Add a comment about this page